Home | Projects | Notes > MCU Peripheral Drivers > Using printf() with Serial Wire Viewer (SWV)
Using printf() with Serial Wire Viewer (SWV)
Introduction
Serial Wire Viewer (SWV) is a data trace feature found on many ARM Cortex-M3, M4, M7, M23, and M33 processors. Coretx-M0 and Cortex-M0+ do not have SWV. The SWV frames can be sent out either the one pin SWO (Serial Wire Output) pin or the 4 bit Trace Port.
This notes explains using
printf()over Serial Wire Output (SWO) pin of Serial Wire Debug (SWD) interface.
Serial Wire Debug (SWD)
Two-wire protocol for accessing the ARM debug interface
Part of the ARM Debug Interface Specification v5 and is an alternative to JTAG
The physical layer of SWD consists of two lines:
SWDIO - A bidirectional data line that carries debug-related data (e.g., break point)
SWCLK - A clock driven by the host (i.e., ST Link circuitry)
Both of these are managed by the ST Link circuitry on the board.
By using SWD interface you should be able to program MCUs internal flash, you can access memory regions, and break points, stop/run CPU.
Also, you can use the serial wire viewer for your
printf()statements for debugging.
Not all IDEs support capturing SWO pin. CubeIDE and TrueSTUDIO does!
Test
Copy and past the following code (implementation of
ITM_SendChar()) into thesyscall.cfile of your project. (It goes right after the#includes.)xxxxxxxxxx281/* syscalls.c */23// Implementation of printf like feature using ARM Cortex M3/M4/ ITM functionality4// This function will not work for ARM Cortex M0/M0+5// If you are using Cortex M0, then you can use semihosting feature of openOCD67//Debug Exception and Monitor Control Register base address8910/* ITM register addresses */11121314void ITM_SendChar(uint8_t ch)15{1617//Enable TRCENA18DEMCR |= ( 1 << 24);1920//enable stimulus port 021ITM_TRACE_EN |= ( 1 << 0);2223// read FIFO status in bit [0]:24while(!(ITM_STIMULUS_PORT0 & 1));2526//Write to ITM stimulus port027ITM_STIMULUS_PORT0 = ch;28}Also, in the
_write()system call, do the following modification:xxxxxxxxxx131/* syscalls.c */23__attribute__((weak)) int _write(int file, char *ptr, int len)4{5int DataIdx;67for (DataIdx = 0; DataIdx < len; DataIdx++)8{9// __io_putchar(*ptr++); // commented out by Klee to implement printf like feature10ITM_SendChar(*ptr++); // added this instead to use ITM feature11}12return len;13}Don't forget to make this modification. I've spent hours to figure out why I couldn't see the
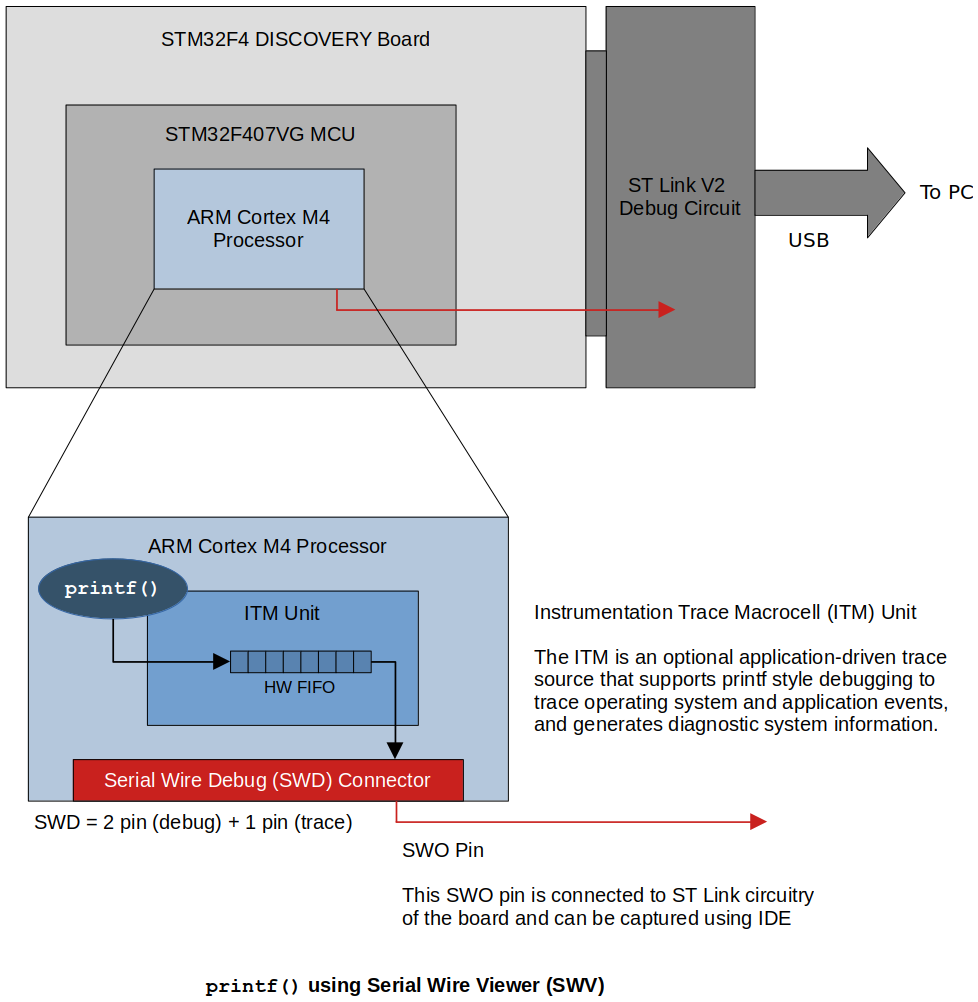
printf()messages from the SWV ITM Data Consol.The way
printf()works is as follows:xxxxxxxxxx21/* your project */2printf();xxxxxxxxxx51/* printf implementation in the standard library */2printf()3{4__write();5}xxxxxxxxxx81/* your project (in syscall.c) */2__write()3{4ITM_SendChar();5LCD_SendChar(); /* if using LCD */6UART_SendChar(); /* if using UART */7...8}To use
printf()on the program for target board, set the Debug Configurations as follows: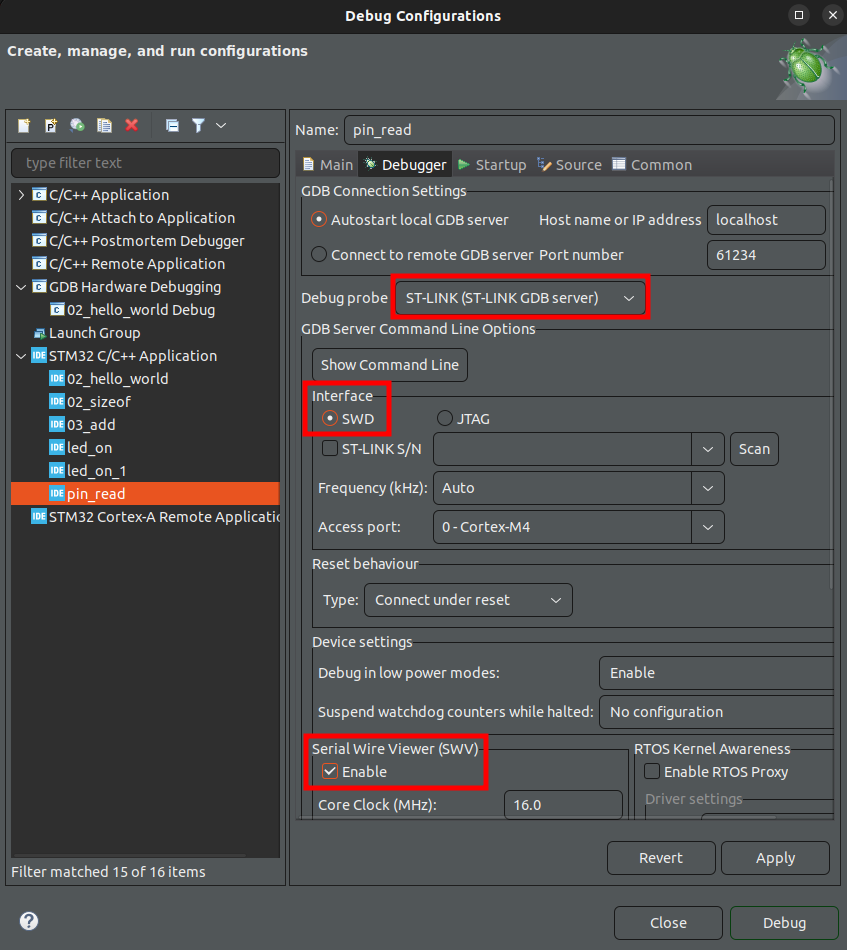
Debug as target application
Window
Click "Configure trace" and select the port 0
Now, click on the "Start trace" button and run the code.
SWD vs. JTAG
JTAG was the traditional mechanism for debug connections for ARM 7/9 family, but with the Cortex-M family, ARM introduced the Serial Wire Debug (SWD) interface.
SWD is designed to reduce the pin countr required for debug from 4 used by JTAG (excluding GND) down to 2.
In addition, SWD interface provides one more pin called Serial Wire Output (SWO) which is used for Single Wire Viewing (SWV), which is a loc cost tracing technology.
References
Nayak, K. (2022). Embedded Systems Programming on ARM Cortex-M3/M4 Processor [Video file]. Retrieved from https://www.udemy.com/course/embedded-system-programming-on-arm-cortex-m3m4/